This section provides a selection of data to better understand housing needs in Chester County. For additional data questions contact the Planning Commission at cObfuscationcplanning@Obfuscationchesco.org.
Population and Households
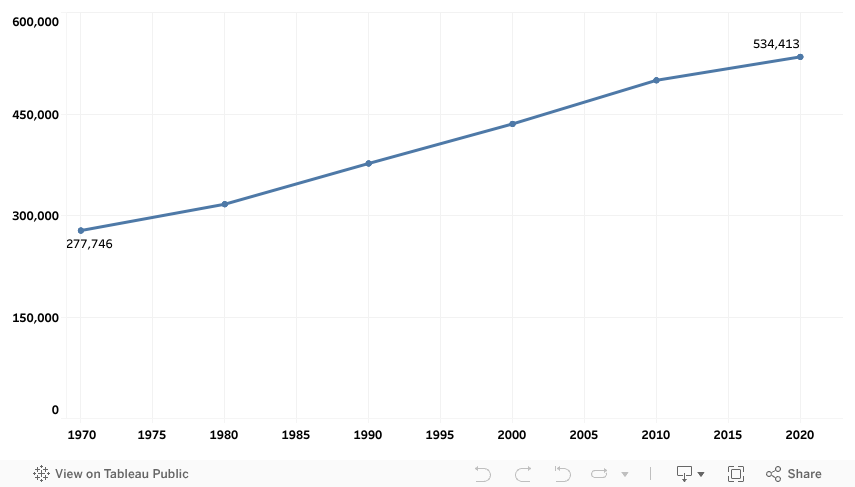
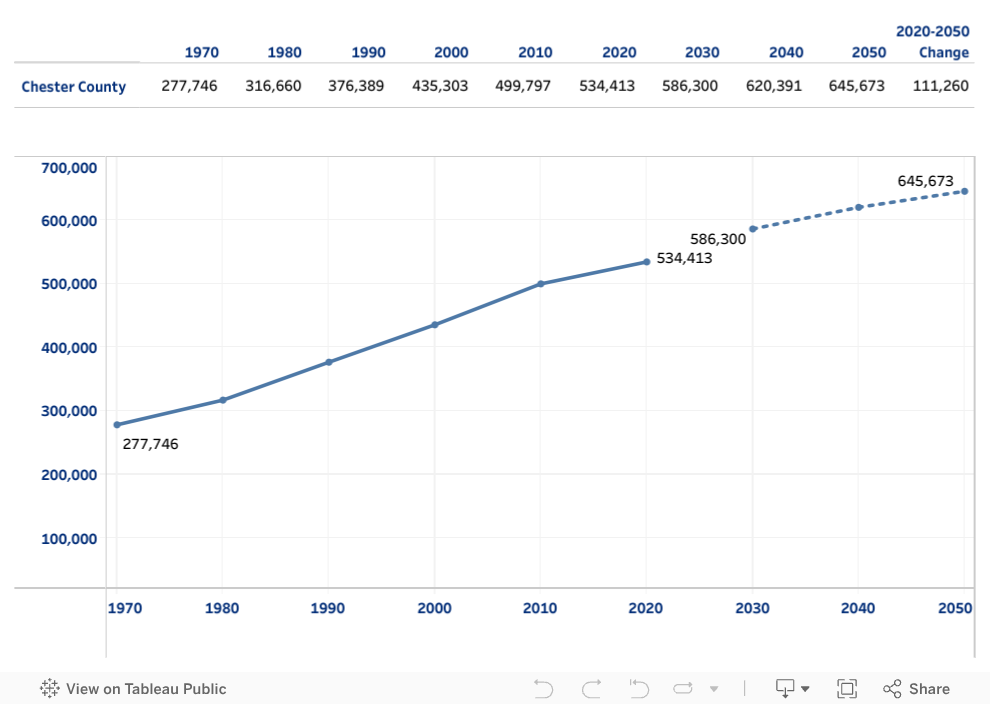
Chester County Total Population, 1970-2020
The population in the county has been steadily growing, up from 277,746 in 1970, to 534,413 in 2020.
Source: US Census
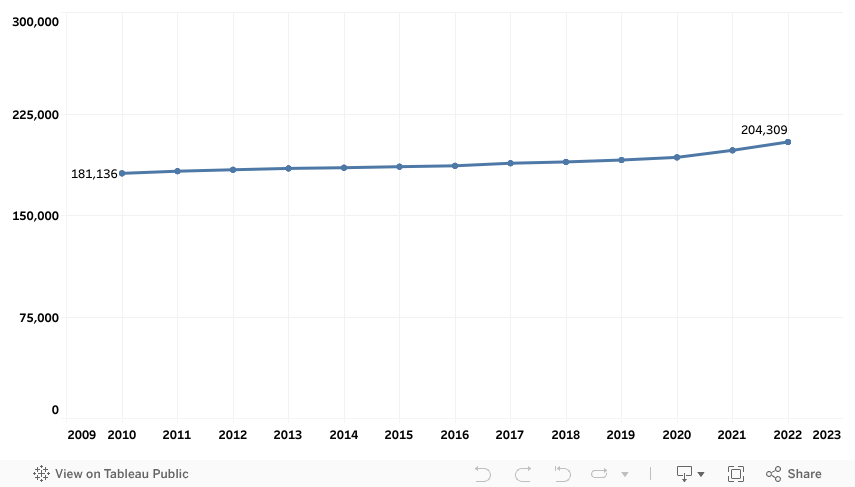
Chester County Households, 2010-2022
Chester County Households have also been growing, and since 2010 have accounted for the second highest percentage of the change in households in the region, second only to Philadelphia.
Source: US Census
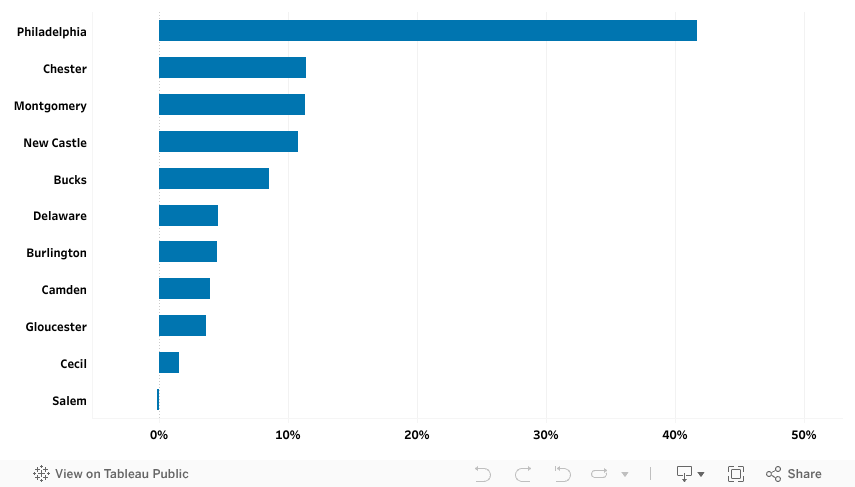
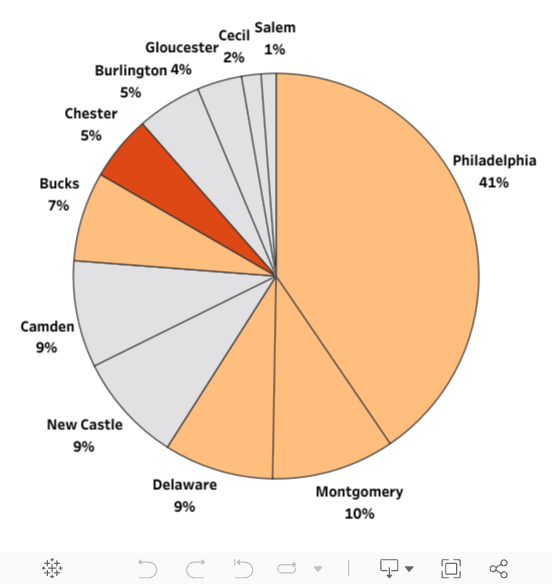
Regional Household Share Rate
From 2010 to 2022 the region grew by approximately 203,061 households. Chester County accounted for 11.4% of this total growth, the second highest growth capture rate, beat only by Philadelphia.
Source: US Census 5yr S1101
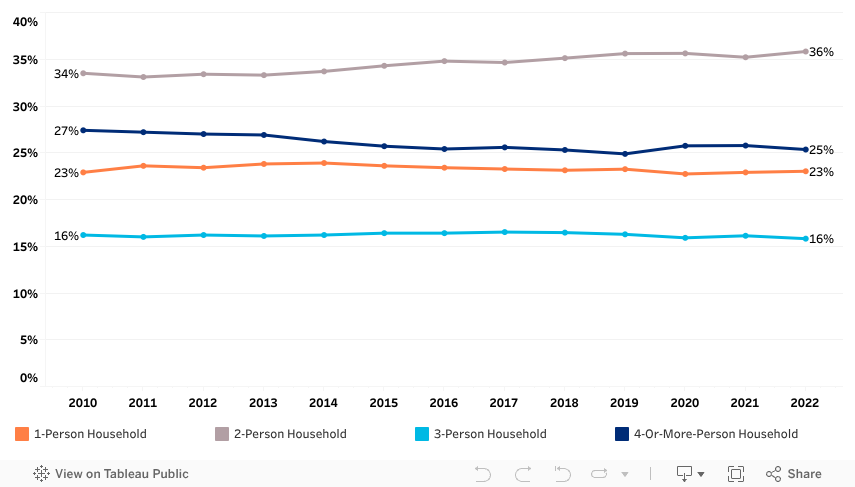
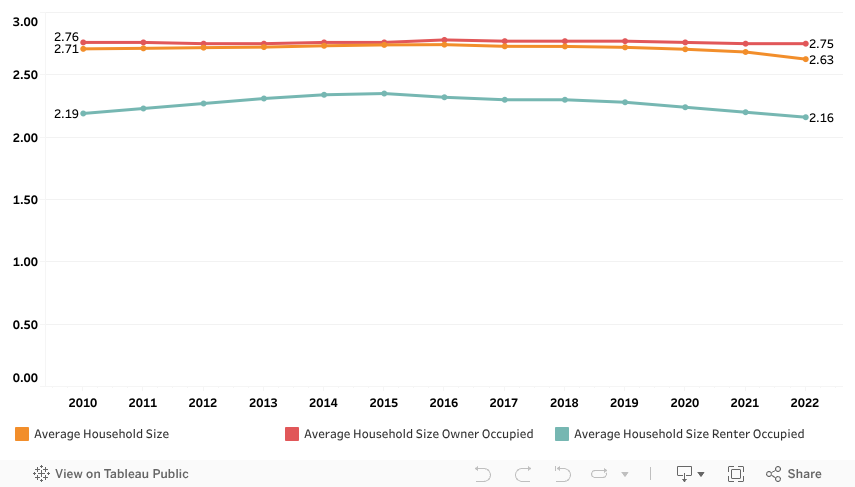
Chester County Household Size, 2010-2022
Meanwhile, average household size has been decreasing, especially for renters.
Source: US Census
Average Household Size
The average household size has been decreasing sightly due to the average household size of renters decreasing. The average household size for homebuyers in the county has remained fairly consistant around 2.75.
Source: US Census
Change in Family and Non-Family Households
Chester County has seen a decrease in family households, while non-family households have become more common. This decrease is likely tied to a growing aging population, lack of housing turnover, and new apartment growth, which caters more to one and two person households.
Total household growth in Chester County was driven by non-family household growth, while households with children decreased from 2011-2022.
All Households
9.8%
Non-Family Households
10.4%
Households With Children
-1.2%
Source: ACS 5-Yr S1101
Current Housing Gap
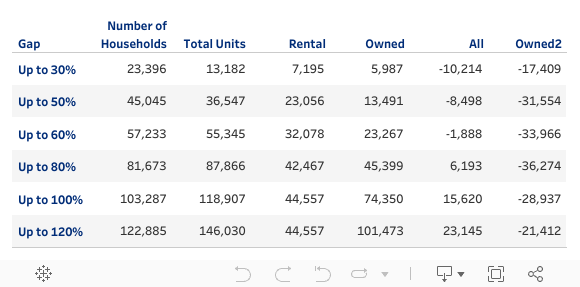
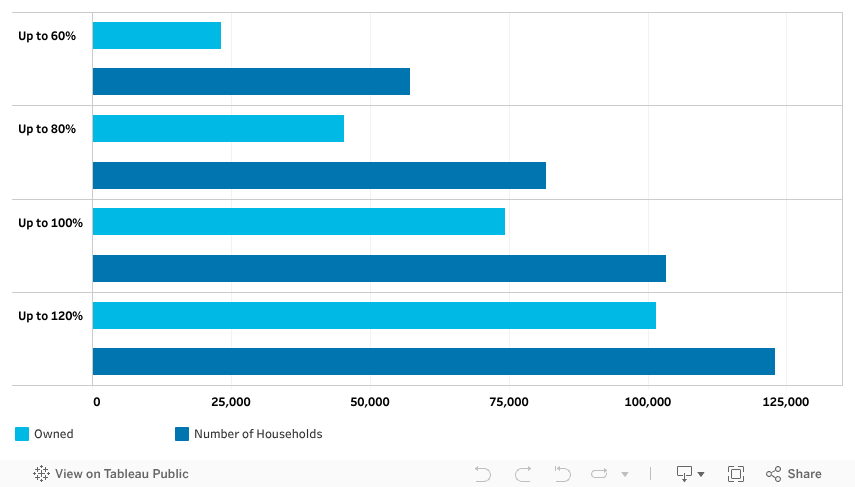
Housing Inventory Price Gaps
The Chester County Planning Commission completed an analysis on the gap between existing housing inventory and the inventory needed to accommodate all current resident households in income brackets up to 120% Area Median Income (AMI) without causing housing cost burden (paying more than 30% of income towards housing costs). The result showed that when looking at both homes for rent and sale the county has sufficient supply to house residents earning up to 80% AMI and higher, but an additional 1,888 units would be needed to house households earning up to 60% AMI.
Source: US Census ACS-5YR, Nerd Wallet, US Census PUMS 1Yr
This analysis only accounts for households currently living within the county, and therefore does not account for those employed or priced out of living in the county.
Source: US Census ACS-5YR, Nerd Wallet, US Census PUMS 1Yr
Projected Housing Need
Chester County Projected Population
Based only on projected future population growth (from the Delaware Valley Regional Planning Commission), the county is expected to add 111,260 new households by 2050 which will require an estimated 39,894 new units.
Source: US Census, DVRPC Projections
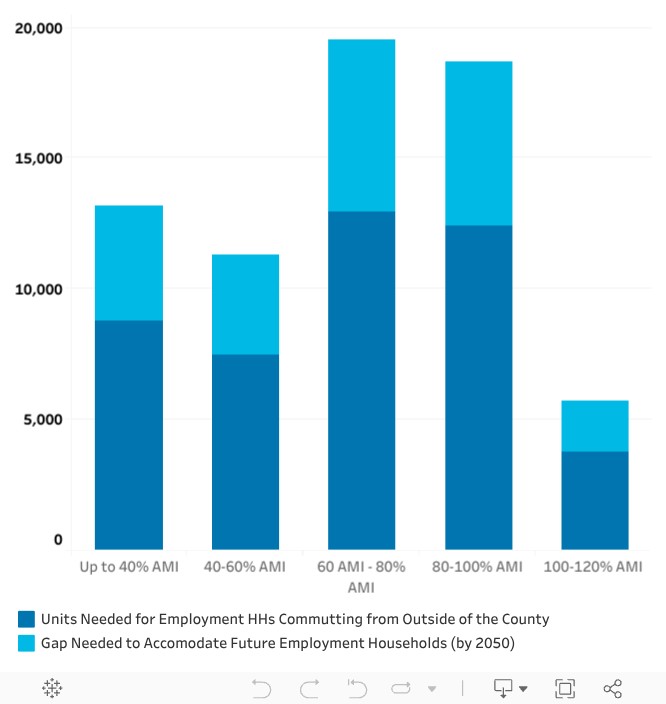
Projected Housing Need Based on Employment
However, this projection does not account for the additional need of those employed within the county. Based on calculations conducted by the Chester County Planning Commission, an additional 65,698 units would be required to house workers currently employed within the county but living elsewhere. This does not account for workers who live outside of the county by choice. DVRPC has a projected employment growth of 47,238 new workers from 2020 to 2050. An additional 33,355 households would be required to accommodate future employment growth through 2050. These figures cannot be combined with the population-based projection due to an overlap in households.
Source: Bureau of Labor Statistics
The employment-based housing need projections provide insight into future housing needs by income. To house both workers who currently commute into the county and future projected employment growth, 13,202 units would be needed for households earning up to 40% AMI, 11,292 for households earning between 40% and 60% AMI, 19,512 for households earning between 60% and 80% AMI, 18,717 for households earning between 80% and 100% AMI, and 5,695 for households earning between 100% and 120% AMI.
Tenure
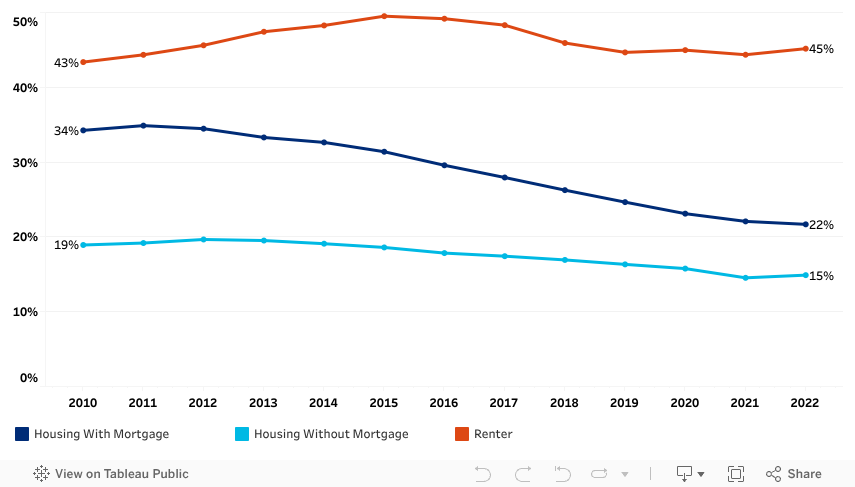
Chester County Tenure 2010-2022
The rate of homeownership in the county has remained steady, decreasing only by 3% from 2010 to 2022.
Source: US Census, ACS 5Yr
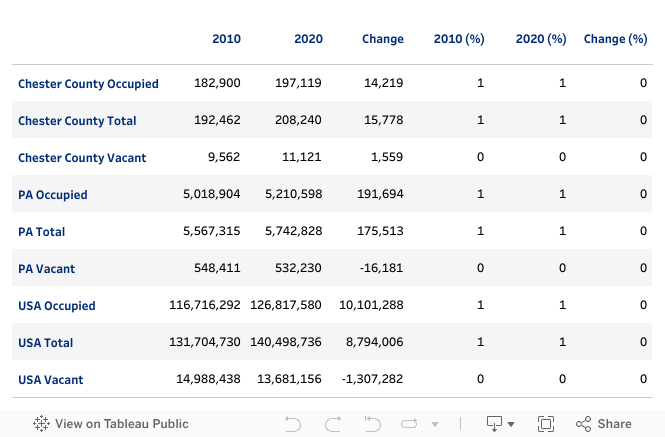
Chester County Vacancy
Chester County has had a low vacancy rate (for all units) of 5%, which has remained consistent from 2010-2020. The vacancy rate is lower than both PA and the US as the county has high demand for residency.
Source: US Census ACS 5Yr
Homeownership Rate by Income
While the homeownership rate has decreased for all income brackets, the decrease was highest for those with household incomes of $50,000-$150,000
Source: US Census
Chester County Ownership Rate By Age, 2011-2022
The rate of homeownership has decreased for almost all age populations in Chester County, except for those over 85. The homeownership rate for those 35 and under decreased by the greatest amount, which could be due to affordability issues or changing living style preferences. The total number of households in all age groups 54 and under decreased while households above this age increased, indicating that residents have been aging up and remaining in the community, with younger households not moving in.
Source: US Census ACS 5Yr
Tenure by Race
Black or African American and Hispanic homeownership has lagged behind other races and ethnicities in the county. Chester County's Black or African American homeownership is lower than the Philadelphia Metro area.
Source: US Census
Mortgage Applications by Income, 2018-2022
Lower income and Black/African American households are more likely to be denied for mortgages, further increasing the homeownership gaps.
Home Mortgage Disclosure Act Database
Mortgage Applications by Race, 2018-2022
Home Mortgage Disclosure Act Database
Chester County Year Moved
The majority of households in the county moved in after 2010, with 35% moving from 2010 to 2019, and 22% arriving in 2020 or later.
Source: ACS 1Yr
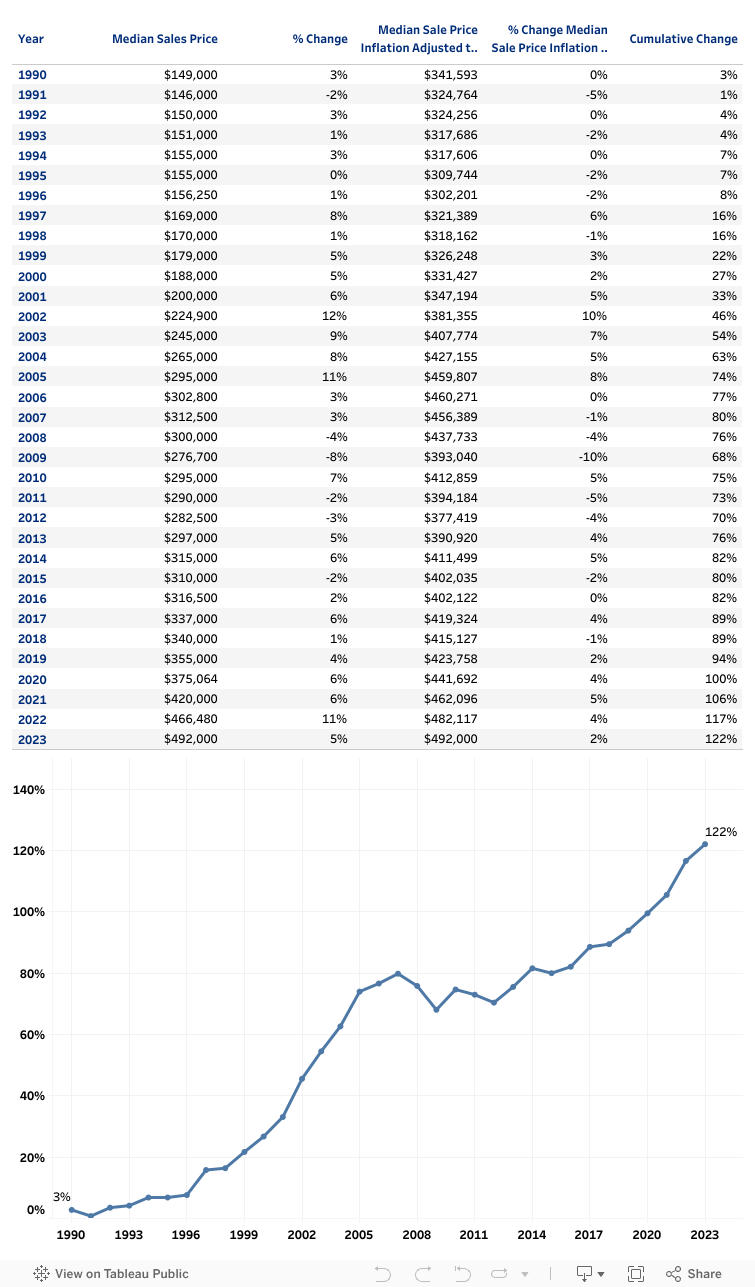
Housing Unaffordability
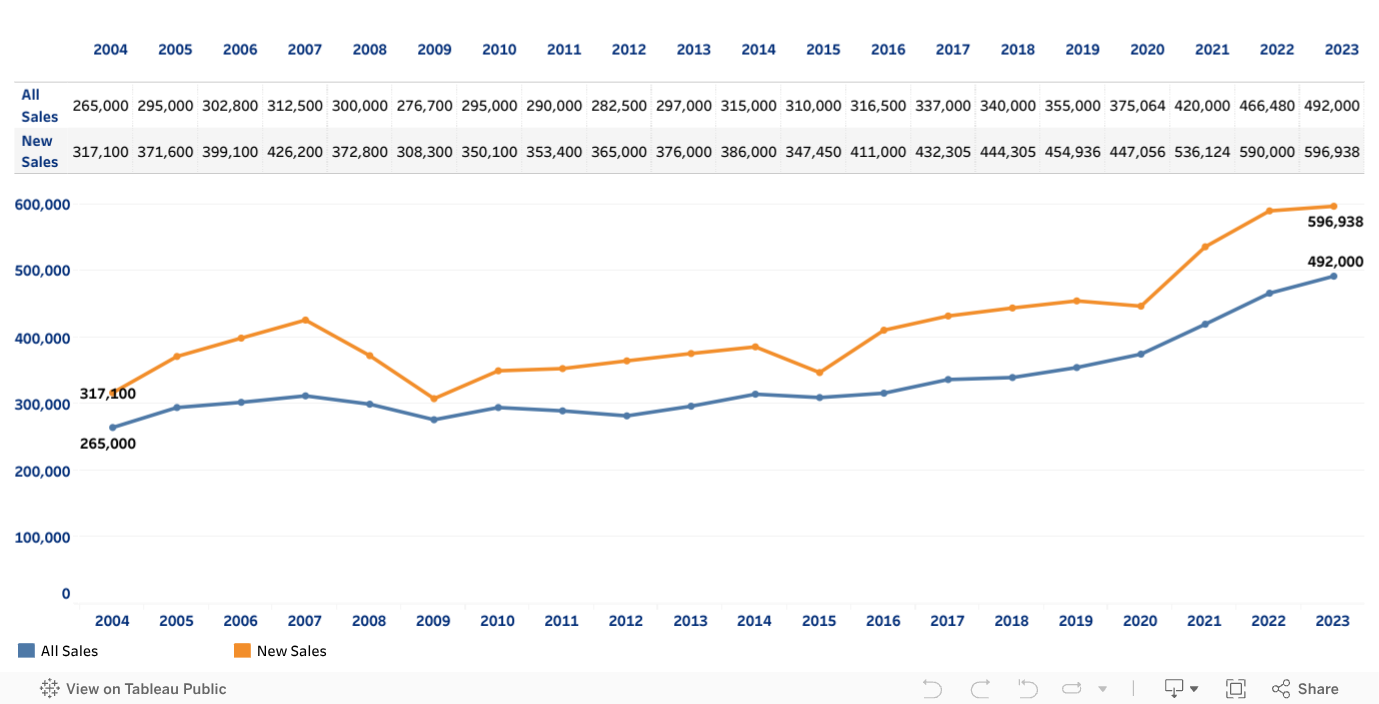
Housing costs in the county have been rapidly increasing due to multiple factors including local policy, national trends, and demographic changes. In the early 2000s, the county saw large gains in pricing, but rising housing prices slowed after the 2008 recession. However, in 2017 the rate of change began increasing again and has been steadily climbing since. Each year since 2021 has seen record highs for housing sales costs, even after accounting for inflation, reaching a high of $492,000 in 2023.
Annual Median Houshold Price
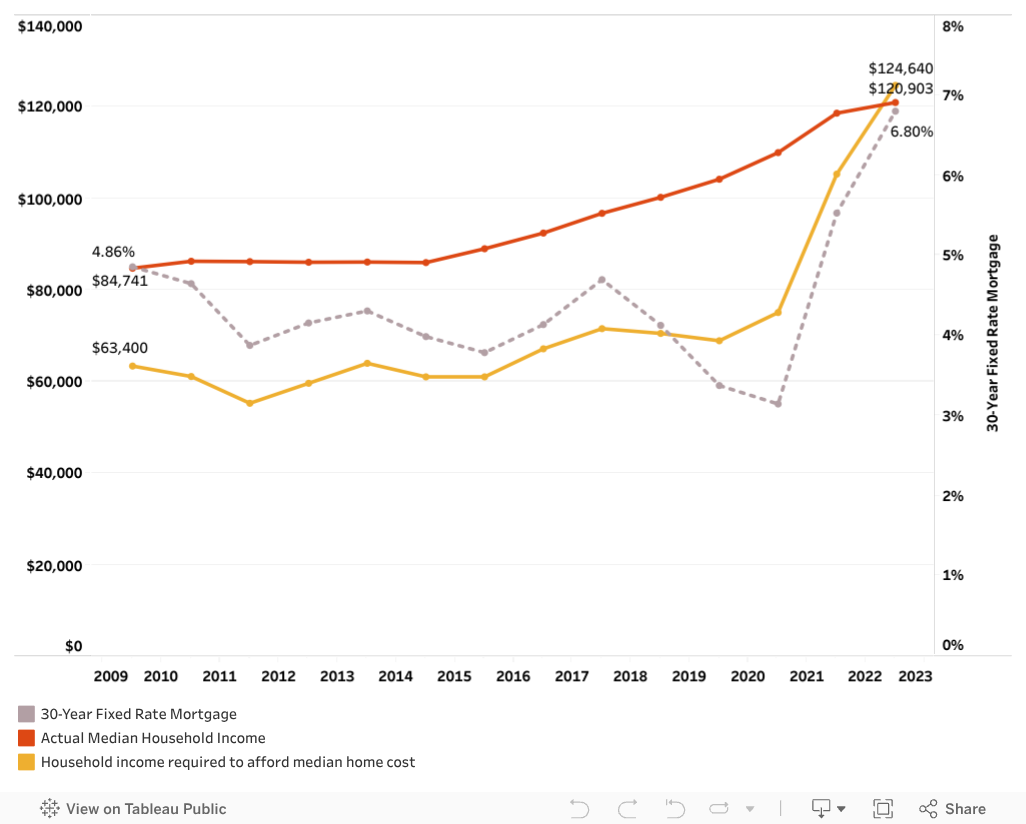
Prior to 2021, the income required to purchase the median priced home in Chester County was far below the actual median income. However, in 2022 the gap began to decrease, and in 2023 the income required to afford the median priced home was higher than the actual median household income. These changes corresponded to raising mortgage rates.
Source: Chester County Assessment Data
Annual Household Income Required to Purchase a Home in Chester County
Median sales prices for new homes have increased to even higher figures, rising as high as $596,938 in 2023.
Source: US Census ACS-5YR, 1 yr for 2023
New Housing Unit Sales
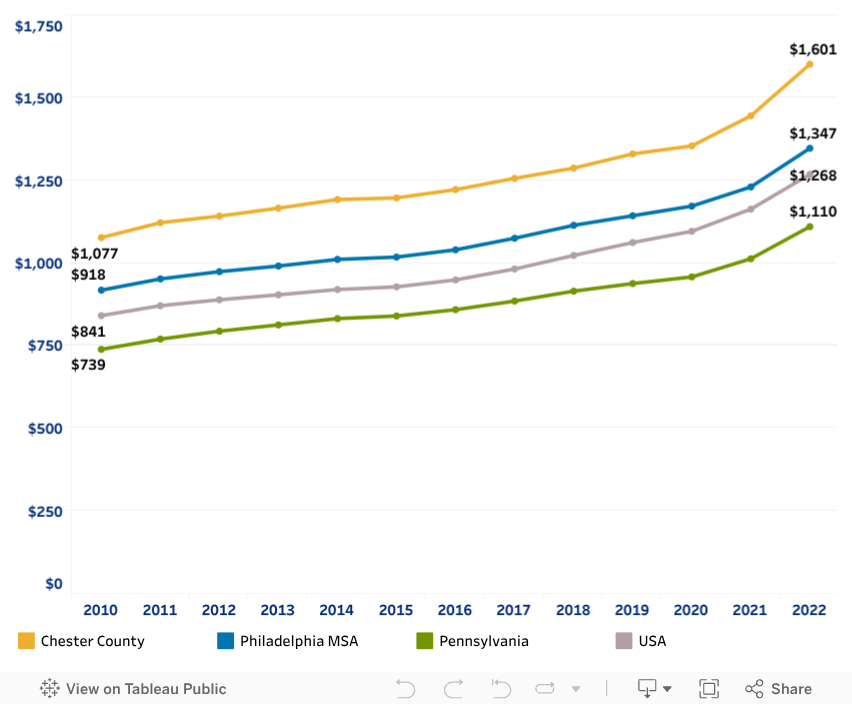
Rent costs have also increased steadily, and are significantly higher than the region, Pennsylvania, and the US.
Source: Chester County Assessment Data
Annual Median Rent Price
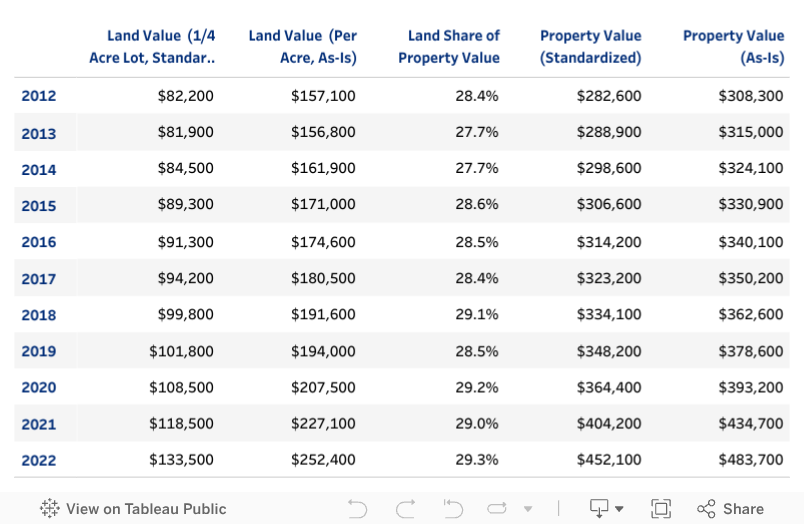
The high cost of land in Chester County contributed significantly to the rising housing prices in the county. Since 2012, land value per acre has increased by almost $100,000.
Source: US Census ACS 5Yr
Land Value
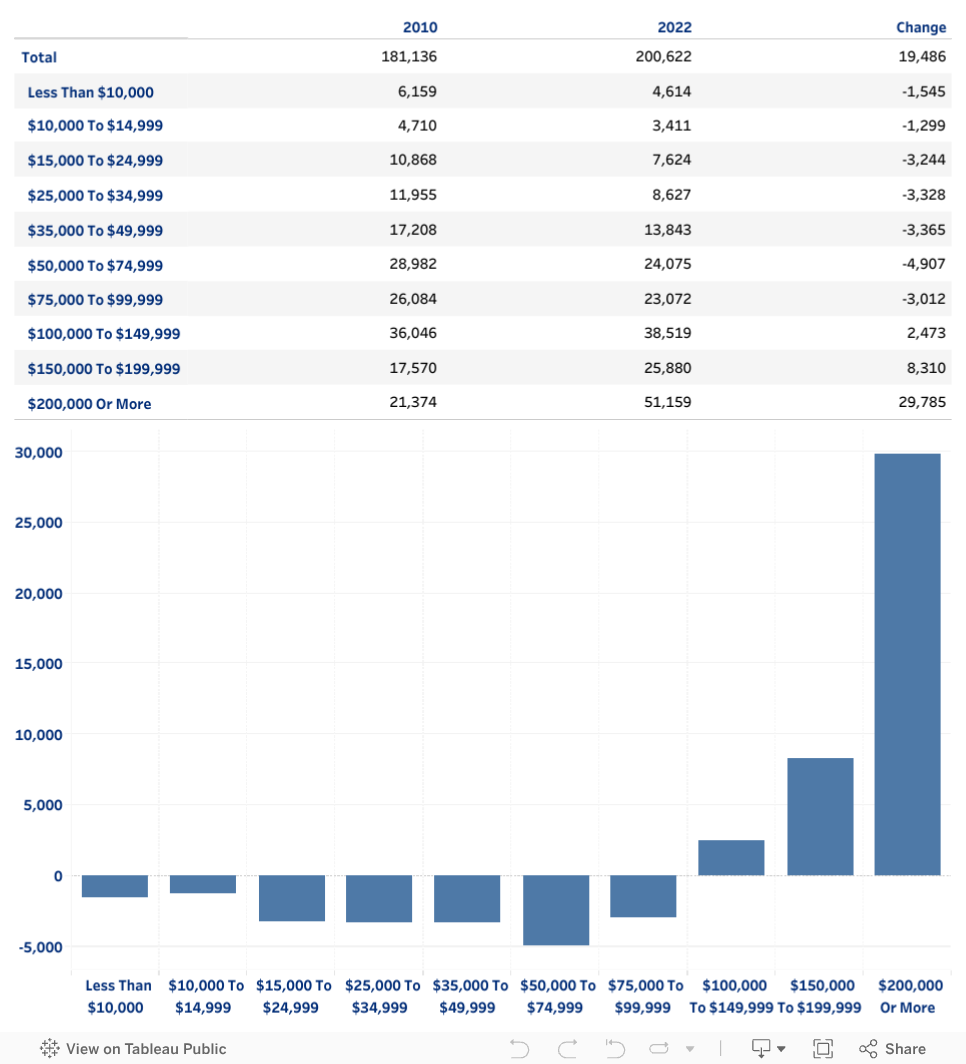
The unaffordability is more pronounced for younger households, households of color, and lower income households
From 2010-2022, Chester County has seen declines in households earning under $100,000, while the growth in households earning more than $200,000 per year has skyrocketed.
Source: Federal Housing Finance Agency
Households by Income Bracket
Additionally, Chester County has had the smallest share in Southeast Pennsylvania in the Philadelphia MSA for new low-income households, at only 5%.
Source: ACS 5-Yr S1901
Share of Low-Income Households (under $50k)
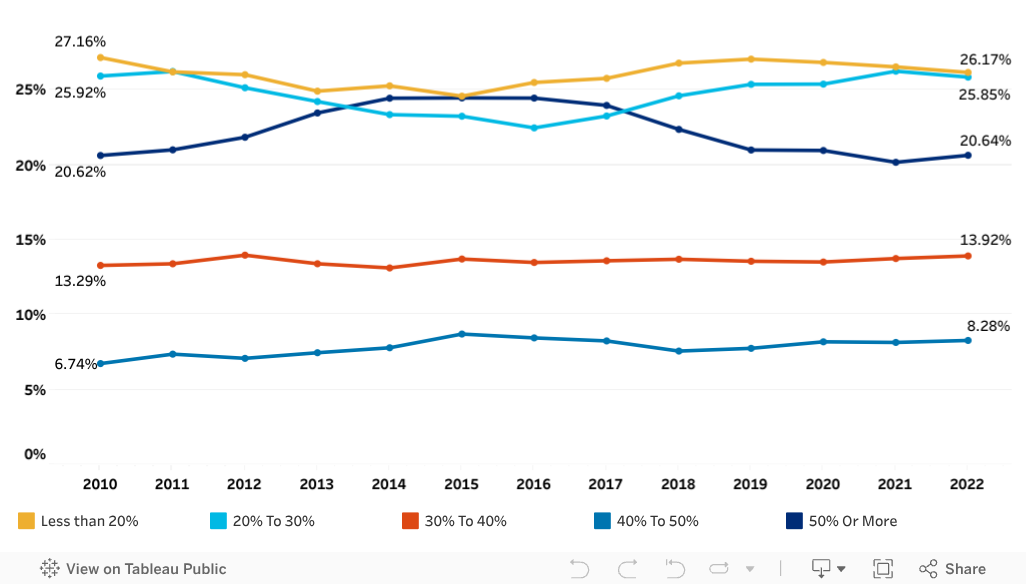
Rising rent prices has resulted in an increase in lower-income renter households being housing cost burdened (spending 30% or more of their income on housing). The percentage of lower income rental households in the county who are housing cost burdened is generally higher than for the region, Pennsylvania, or the US.
Source: ACS 5-Yr S1901
Gross Median Rent as a Percentage of Income
Source: US Census, ACS 5Yr, B25070
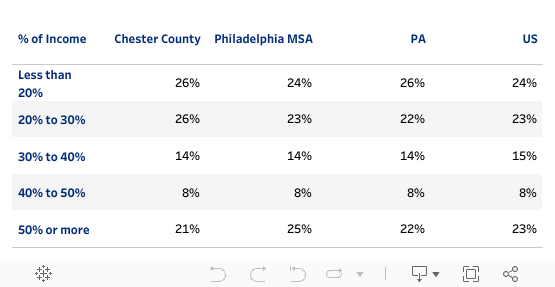
Gross Median Rent as a Percentage of Income — Compared to Local, Regional, and National areas 2022
Rising housing sales prices in the county have resulted in lower-income households being priced out of the county. This is demonstrated by a decline in the total number of lower-income households who own their homes, combined with the minimal number of housing cost burdened lower-income households who own.
US Census, ACS 5Yr, DP04
Selected Monthly Owner Costs as a Percentage of Household Income
Source: US Census, ACS 5Yr, DP04
Cost-Burdened Households
Source: US Census ACS-5YR
Housing Type
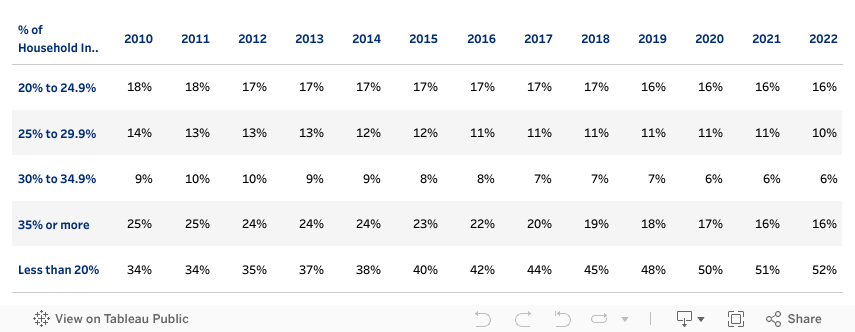
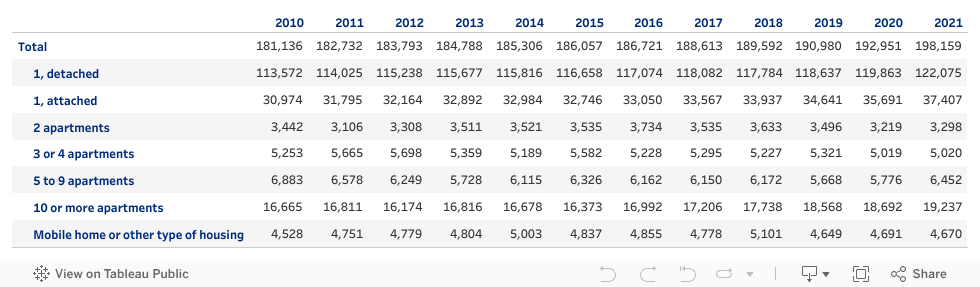
Chester County Housing Inventory
In 2021, the county had a total of 198,159 units. Chester County's housing stock is concentrated in one-unit detached buildings, which constitute 62% of the total inventory. Only 10% of the housing stock is apartments of 10 or more units. Mobile homes make up the smallest percentage of the county's housing stock at 2% followed by two-to-nine-unit apartments, accounting for 8% of the total housing stock.
Source: US Census
New Unit Construction Compared to Population Growth
The county's supply of housing is insufficient to meet the demand. Chester County saw a decline in new unit construction from 2008 to 2020, despite a growing population.
Source: Assessment Data / CCPC Housing Report
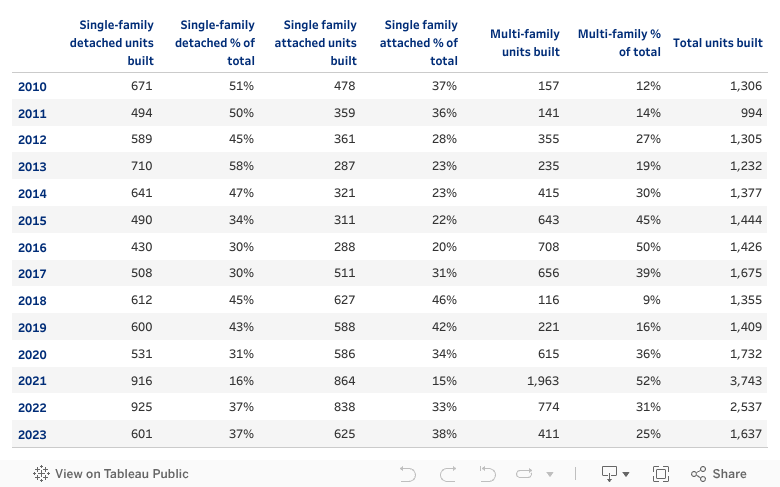
New Construction Housing Types
New construction in the county since 2010 has been fairly evenly distributed between single family detached units (38%), single family attached units (30%), and apartments (32%).
Source: Chester County Assessment Data
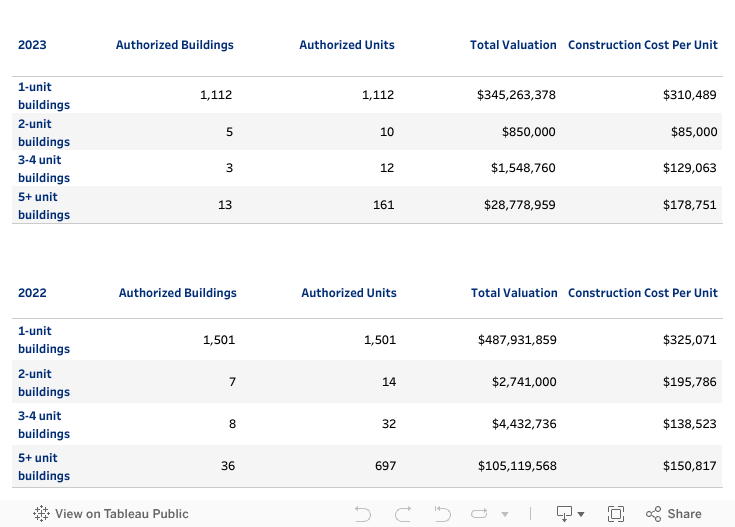
Construction Costs Per-Unit in Chester County
Construction cost per unit was far higher for one-unit buildings than for any other type. However, construction cost per unit decreased for one-to-four-unit buildings between 2022 and 2023, but increased for five or more unit buildings.
Source: US Census Building Permit Study
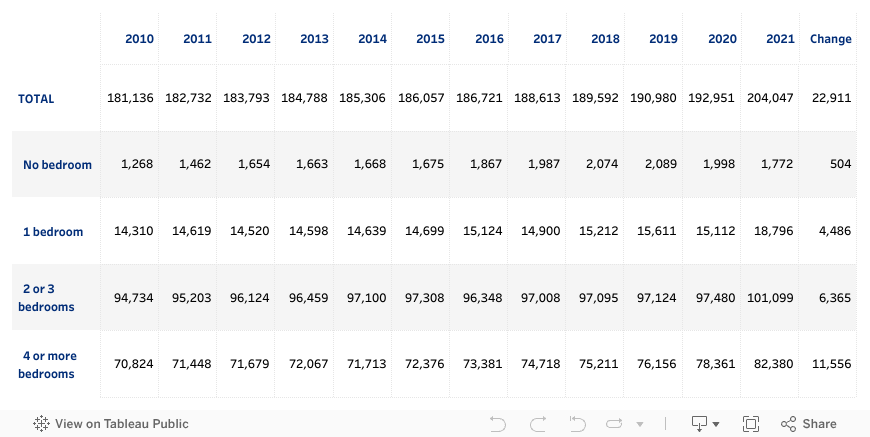
Bedrooms
Despite the average household size decreasing, Chester County has continued to add higher bedroom units, building 11,556 new four or more-bedroom units between 2010 and 2021.
Source: US Census
Bedrooms Compared to Household Size
Source: US Census
Overhoused and Overcrowded — Rental
This has resulted in many Chester County residents being overhoused, defined as having two or more extra bedrooms than the number of residents. The county has a relatively low percentage of overcrowded households, defined as having two or more rooms fewer than the number of residents. Renters are more likely to be overcrowded, while homeowners are more likely to be overhoused.
Source: U.S Census 1-Year PUMS Data
Overhoused and Overcrowded — Ownership
Source: U.S Census 1-Year PUMS Data
Bedrooms Compared to Age
Younger generations are far more likely to live in units with fewer bedrooms.